Analytics Dashboards are a collection of data visualisations to represent your business performance.
How To Access Your Analytics Dashboard
1. Login to your Yezza account.
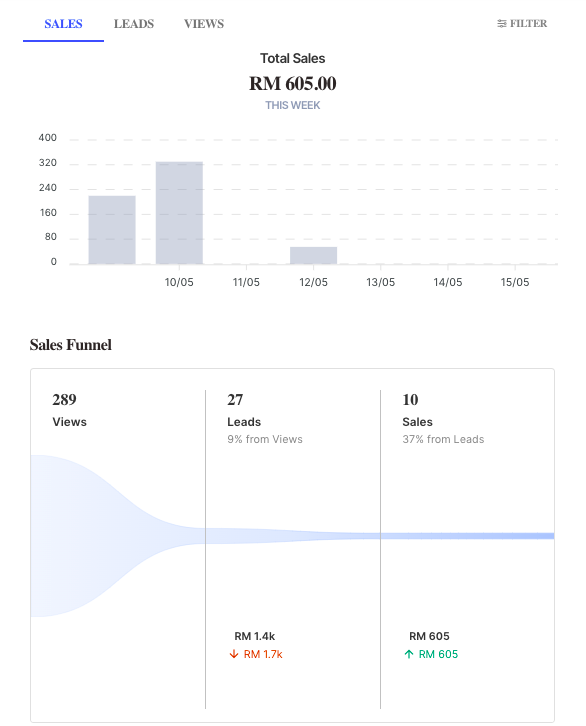
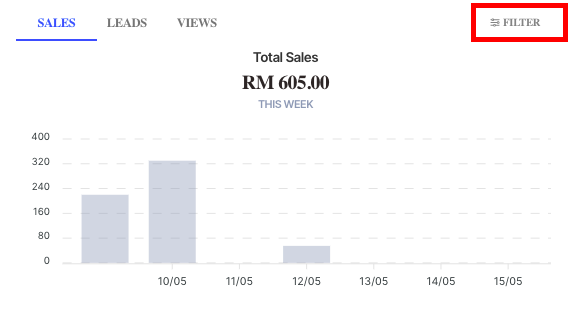
2. Click on "Analytics" on the left side menu of your account. Here, you can access the three sets of metrics which are Sales, Leads, and Views. By default, the dashboard shows data for this week.

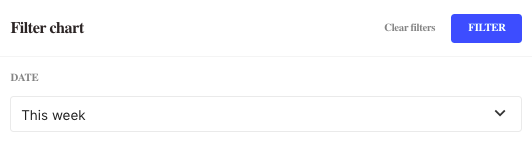
3. If you want to see data for another date range, click "Filter" at the top-right corner and select a different date range from the dropdown.
The following metrics are shown on the Analytics page:
| Sales |
Shows the sales amounts Note: The amount shown does not include shipping rates and discounts |
| Leads | People who have expressed interest in your products or services by filling up your WhatsApp Form or key in details in checkout form. |
| Views | The number of times visitors view your store |
Sales Funnel
A sales funnel is the process someone goes through to become a customer.
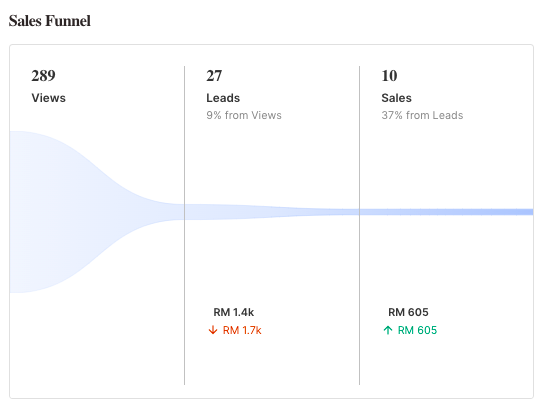
From the example, the store has been viewed 289 times in a week. From 289 visitors, 27 of them are interested with the store's products or services either by filling out forms, adding products to the cart, etc. The last section of the funnel shows 10 of the Leads completing the transaction and becoming the buyers.
Comments
0 comments
Please sign in to leave a comment.