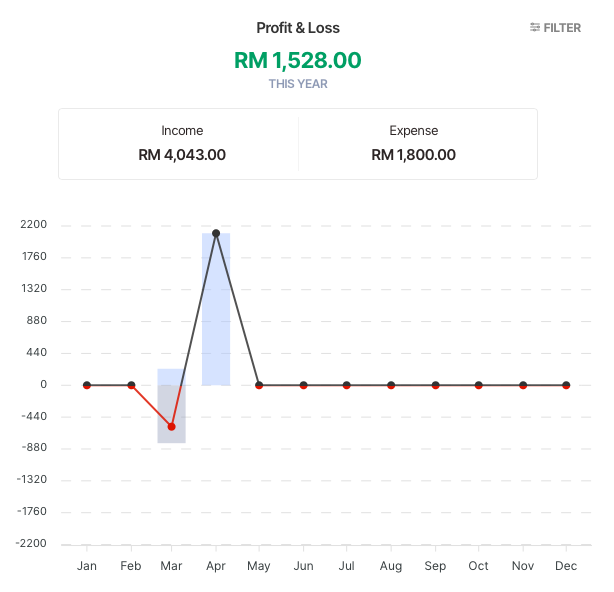
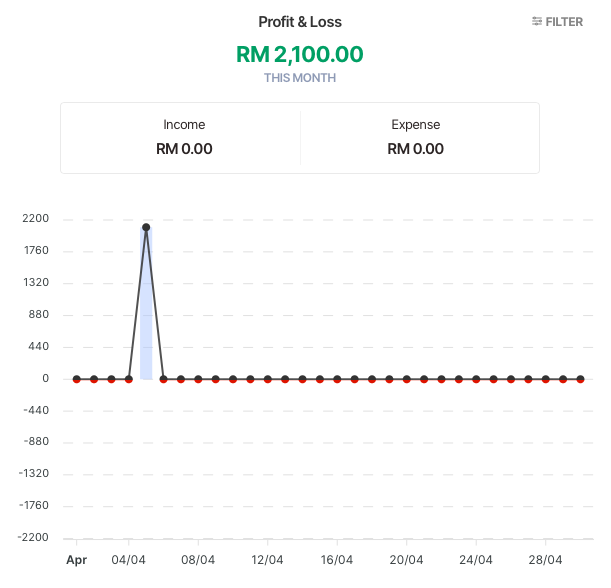
2. See on screen 'Profit & Loss'
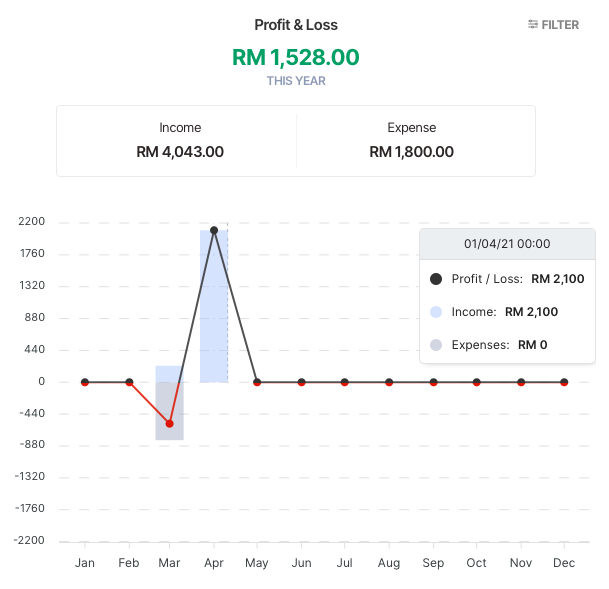
3. Hover or click on data to see details
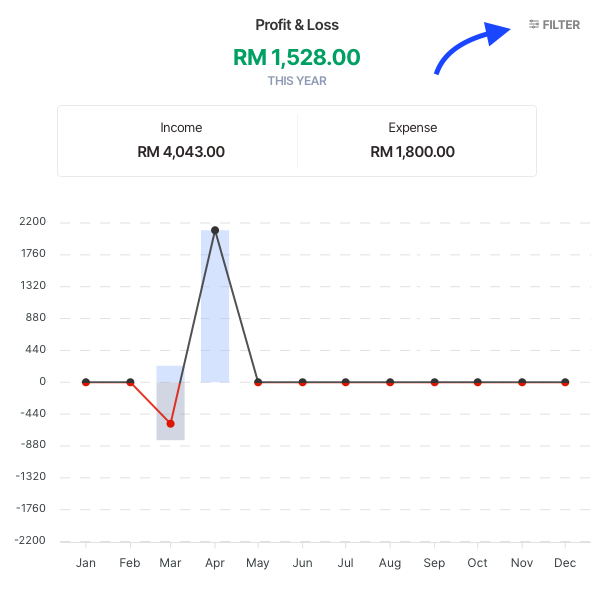
4. Use 'Filter' to change data scale.
-
Click Home button
-
See on screen 'Profit & Loss'
- Green = Profit
- Red = Loss
- Below example is for throughout the year.
-
Hover or click on data to see details
-
Use Filter to change data scale.
-
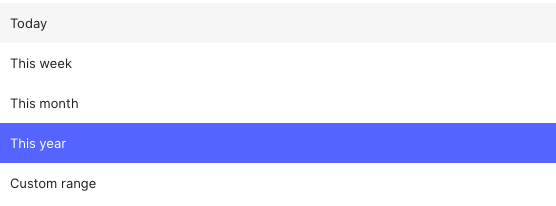
Choose 1 out of 5 period options.
- Today
- This week
- This month
- This year
- Custom Range
-
-
-
Below is a 'This Month' example
-
-

Comments
0 comments
Please sign in to leave a comment.